
picture alliance / ASSOCIATED PRESS / Ng Han Guan
Tracker
Economic Indicators
Economic momentum falters over Q2
MERICS Economic Indicators Q2/2024
MERICS Q2 analysis: China’s leadership faces an uphill battle to shore up confidence
After a relatively strong start to the year, China’s economy lost momentum in the second quarter of 2024. Real GDP growth slowed to 4.7 percent in Q2, down from 5.3 percent in the previous quarter. The economy is struggling with weak consumption and the ripple effects of the government-led crackdown on the bloated real estate sector. It suffers from low confidence among investors and households alike. The CNY/USD exchange rate has fallen to levels last seen in 2008, and the economy remains on the verge of deflation. Despite these many problems, China’s leadership is reluctant to roll out meaningful stimulus packages. Instead, economic policies are fully focused on establishing a new growth model centered around innovation and manufacturing.
China's leadership probably anticipated a more favorable economic environment when it chose mid-July for the Third Plenum, a major meeting of the CCP’s Central Committee which will outline economic policy for the next decade. Instead, weak economic growth has caused growing tensions within China’s middle class, who are facing poorer prospects due to the real estate crackdown’s impact on key asset values and a weak labor market. Local governments are also feeling the strain as tax collection remains weak, further pressuring their finances.
Two crucial questions are how far the awareness of economic weaknesses extends up the chain of command and, more importantly, how much sympathy President Xi Jinping has for middle class economic woes. The leadership seems likely to stick to its current path, despite increasing pressures. Significant stimulus to boost growth appears unlikely. Instead, the government is expected to reinforce its narrative that the country is on the right trajectory.
Restoring confidence among the middle class, as well as within parts of the private sector and foreign companies, will likely rely on rhetoric rather than substantial policy changes. There is no reason to think Xi Jinping will retreat from his signature policies of a stronger role for the Communist Party in guiding the economy and prioritization of manufacturing and innovation. Both are seen as crucial to reaching the medium-term objectives the CCP has set for 2035, and hence are unlikely to be impacted by short-term economic troubles.
China’s new growth model, with its emphasis on channeling resources to innovation and technology, also risks further pushback from trading partners. China’s trade surplus is heading for another record this year, which will provoke stronger responses from the European Union and the United States. The EU is beginning to address the growing challenges posed by China’s manufacturing sector. The lead-up to the US presidential election is likely to surface heightened tensions over trade imbalances and technology access.
Looking ahead, China’s economy faces more headwinds in the second half of 2024. The government's current approach may need reassessment to address the underlying economic challenges effectively if growth fails to improve. However, its focus is on long-term goals and a new growth model, making substantial short-term adjustments in economic policy improbable. Nonetheless, selling China’s new growth model to its middle classes is an uphill battle, with uncertain consequences ahead.
The MERICS China Confidence Index (MCCI)
The MERICS China Confidence Index measures household and business confidence in future income and revenues. The index is weighted between household and business indicators. It includes the following indicators: stock market turnover, future income confidence, international air travel, new manufacturing orders, new business in the service sector, urban households’ house purchase plans, venture capital investments, private fixed asset investments and disposable income as a share of household consumption. All components have been tested for trends and seasonality.
The MCCI was first developed in Q1 2017.
![]() Hover over/tap the charts to see more details.
Hover over/tap the charts to see more details.
Exhibit 1
Macroeconomics: Q2 GDP growth disappoints as government holds back on stimulus
Exhibit 2
![]() Hover over/tap the charts to see more details.
Hover over/tap the charts to see more details.
Exhibit 3
- China's GDP growth slowed to 4.7 percent in Q2, the lowest growth since the last quarter in 2022 when China was still suffering Covid lockdowns (see exhibit 1). The economy faces significant difficulties, largely due to the downturn in the real estate sector and persistently weak consumer spending, and deflation remains a threat.
- Crucial drivers of growth started to slow over Q2, stoking pressures on the economy. Manufacturing growth continues to outpace overall GDP growth, yet it dropped back to 6.2 percent in Q2 from 6.4 percent in Q1. Similarly, growth in IT services and software slowed to 10.2, down from 13.7 in the previous quarter.
- Quarter-on-quarter growth slowed to 0.7 percent in Q2, down from 1.5 percent in Q1. This points to momentum weakening further in the second quarter as the economy lost steam, especially in June.
- GDP expanded by 5 percent in H1, in line with the government's annual growth target. However, weaker growth in Q2 may fuel pressure for the government to find more substantial stimulus measures. However, the government is more likely to favor a gradual approach focused on stabilizing weak economic spots, such as employment, to navigate these economic challenges.
- China's government tax income yield deteriorated in the first five months in 2024 (latest available data). Tax revenue was only 4.8 percent higher than in the same period of 2018 (see exhibit 2). The sluggish revenue increase underscores the challenges the government is facing to maintain fiscal stability, especially for local governments that relied excessively on land sales.
What to watch: A stronger recovery in consumption is key to bringing China’s economy on a more stable footing
Business: High-tech sectors support robust growth in industrial activity
Exhibit 4
![]() Hover over/tap the charts to see more details.
Hover over/tap the charts to see more details.
Exhibit 5
- The manufacturing sector’s overall growth rate was much stronger in the first half of 2024 than year-earlier, demonstrating manufacturing’s importance for the overall economy this year. It was up by 6.5 percent compared to growth of 4.2 percent in H1 2023 and of 2.8 percent in the first half of 2022.
- However, growth slowed during the latter part of Q2, both in overall industrial output and in China’s key manufacturing sector. Overall value-added industrial output rose 6.7 percent year-on-year in April but slowed to 5.3 percent in June. Manufacturing value-added growth increased 7.5 in April, dropping to 5.5 percent in June.
- Growth levels in high-tech industries leapt from 7.6 percent to 11.3 percent between March and April, then eased to 8.8 percent in June. Output in June for integrated circuits rose by 12.8 percent; for industrial robots it was up 12.4 percent; and for new energy vehicles (NEVs) it grew 37 percent.
- Demand for industrial inputs remained strong, suggesting manufacturing enterprises have robust future orders in the books. For example, in the chemical sector, it was up 9.2 percent and in the rubber and plastic products sector it was up 8.6 percent. The machinery and equipment sectors also demonstrated moderate output growth in Q2, yet these figures were partly dampened due to base effects (see exhibit 1).
- Building materials production contracted in Q2 due to ongoing weak investment in the infrastructure and the real estate sectors. Value-added output of cement decreased by 10.7 percent and pig iron by 3.3 percent in June this year, compared to slightly negative growth or none in June 2023.
- Trade tensions with key trading partners have dampened optimism among Chinese industrial enterprises. The official manufacturing PMI fell to 49.5 in June, down from 50.8 in March (see exhibit 2). The United States imposed new tariffs on imports from China in May. The European Commission activated a quid-pro-quo international procurement instrument in April and announced provisional countervailing duties on Chinese electric vehicle exports in June.
What to watch: Despite robust industrial activity in Q2, producers in China will need to navigate the impact of growing trade tensions.
International trade and investment: China’s booming exports face rising trade frictions
Exhibit 6
![]() Hover over/tap the charts to see more details.
Hover over/tap the charts to see more details.
Exhibit 7
- China’s foreign trade is still characterized by booming exports. On a USD basis, exports pulled ahead strongly over Q2, expanding by 8.6 percent in June year-on-year. It was the fastest monthly growth so far this year, though base effects from weak growth in the same period of last year boosted the figures. Exports were up by 3.6 percent in the first half of 2024.
- By contrast, Chinese imports remained dampened by weak domestic demand. Imports expanded by 8.4 percent in April and 1.8 percent in May but contracted again in June, dipping by 2.3 percent.
- The discrepancy between strong exports and weak domestic consumption puts China on track for another record trade surplus in 2024. In June, the surplus reached USD 99 billion, the third highest monthly value on record. In the first half of the year, China’s trade surplus reached USD 435 billion, making another annual record likely (see exhibit 1).
- ASEAN’s share of China’s exports has risen; the bloc is China’s most important export market. ASEAN’s share climbed to 16.7 percent during the first half of the year, up from 15.5 percent at the end of 2023. This contrasts with the EU’s share of China’s exports (14.6 percent) and the United States’ share (14.1 percent), which both slowed further.
- As China continues to move up the value chain the composition of its exports is also changing. China’s manufacturing might is increasingly noticeable in high value products, particularly automotives (see exhibit 2). As a result, growing surpluses have emerged in sectors where China has long-standing trade deficits.
- China’s increasing technological rivalry with advanced economies and its overall trade imbalances risk stoking tensions with major trading partners. The EU has announced it will levy additional tariffs on Chinese EV’s from July onwards and is examining other sectors for distortions, such as barriers to market access for foreign firms in China’s medical equipment market.
What to watch: Chinese exports seem certain to face worsening trade frictions in the second half of the year.
Financial markets: Weak demand pushes credit and monetary growth to record lows
Exhibit 8
![]() Hover over/tap the charts to see more details.
Hover over/tap the charts to see more details.
- Expansion of credit and liquidity hit a record low growth over Q2 (see exhibit 1). Growth in total social financing dropped to a record low in June, expanding by only 8.1 percent year-on-year in June, the lowest on record. The dynamic issuance of government bonds could do little to counterbalance the lowest rise in fresh bank loans ever recorded (8.3 percent). Similarly, monetary aggregates M1 dropped by an unprecedented 5 percent and M2 growth slowed to just 6.2 percent year on year.
- After record liquidity injections in early Q1, the central bank did not take any clear action against the reductions during the second quarter. Monetary policy instruments and rates were mostly left untouched. Tighter regulatory measures were enforced against financial “misbehavior”. These included measures against illegal circumvention of the informal ceiling on interest rates offered to depositors.
- Instead of putting capital in saving deposits, funds have been channeled towards bonds, pushing down rates. Five-year bonds rates have never been so low in China, from treasury bonds at 1.98 percent, to AA- issuers at 3.77. The same is true of the spreads between issuers, from the most solid and the riskiest, indicating the return of a perceived implicit guarantee among investors.
- Stock exchanges tumbled again, confirming investors’ reduced appetite for equity amid uncertain economic dynamics. The Shanghai and Shenzhen exchanges’ main indexes dropped by 2.4 and 7.4 percent respectively over the quarter.
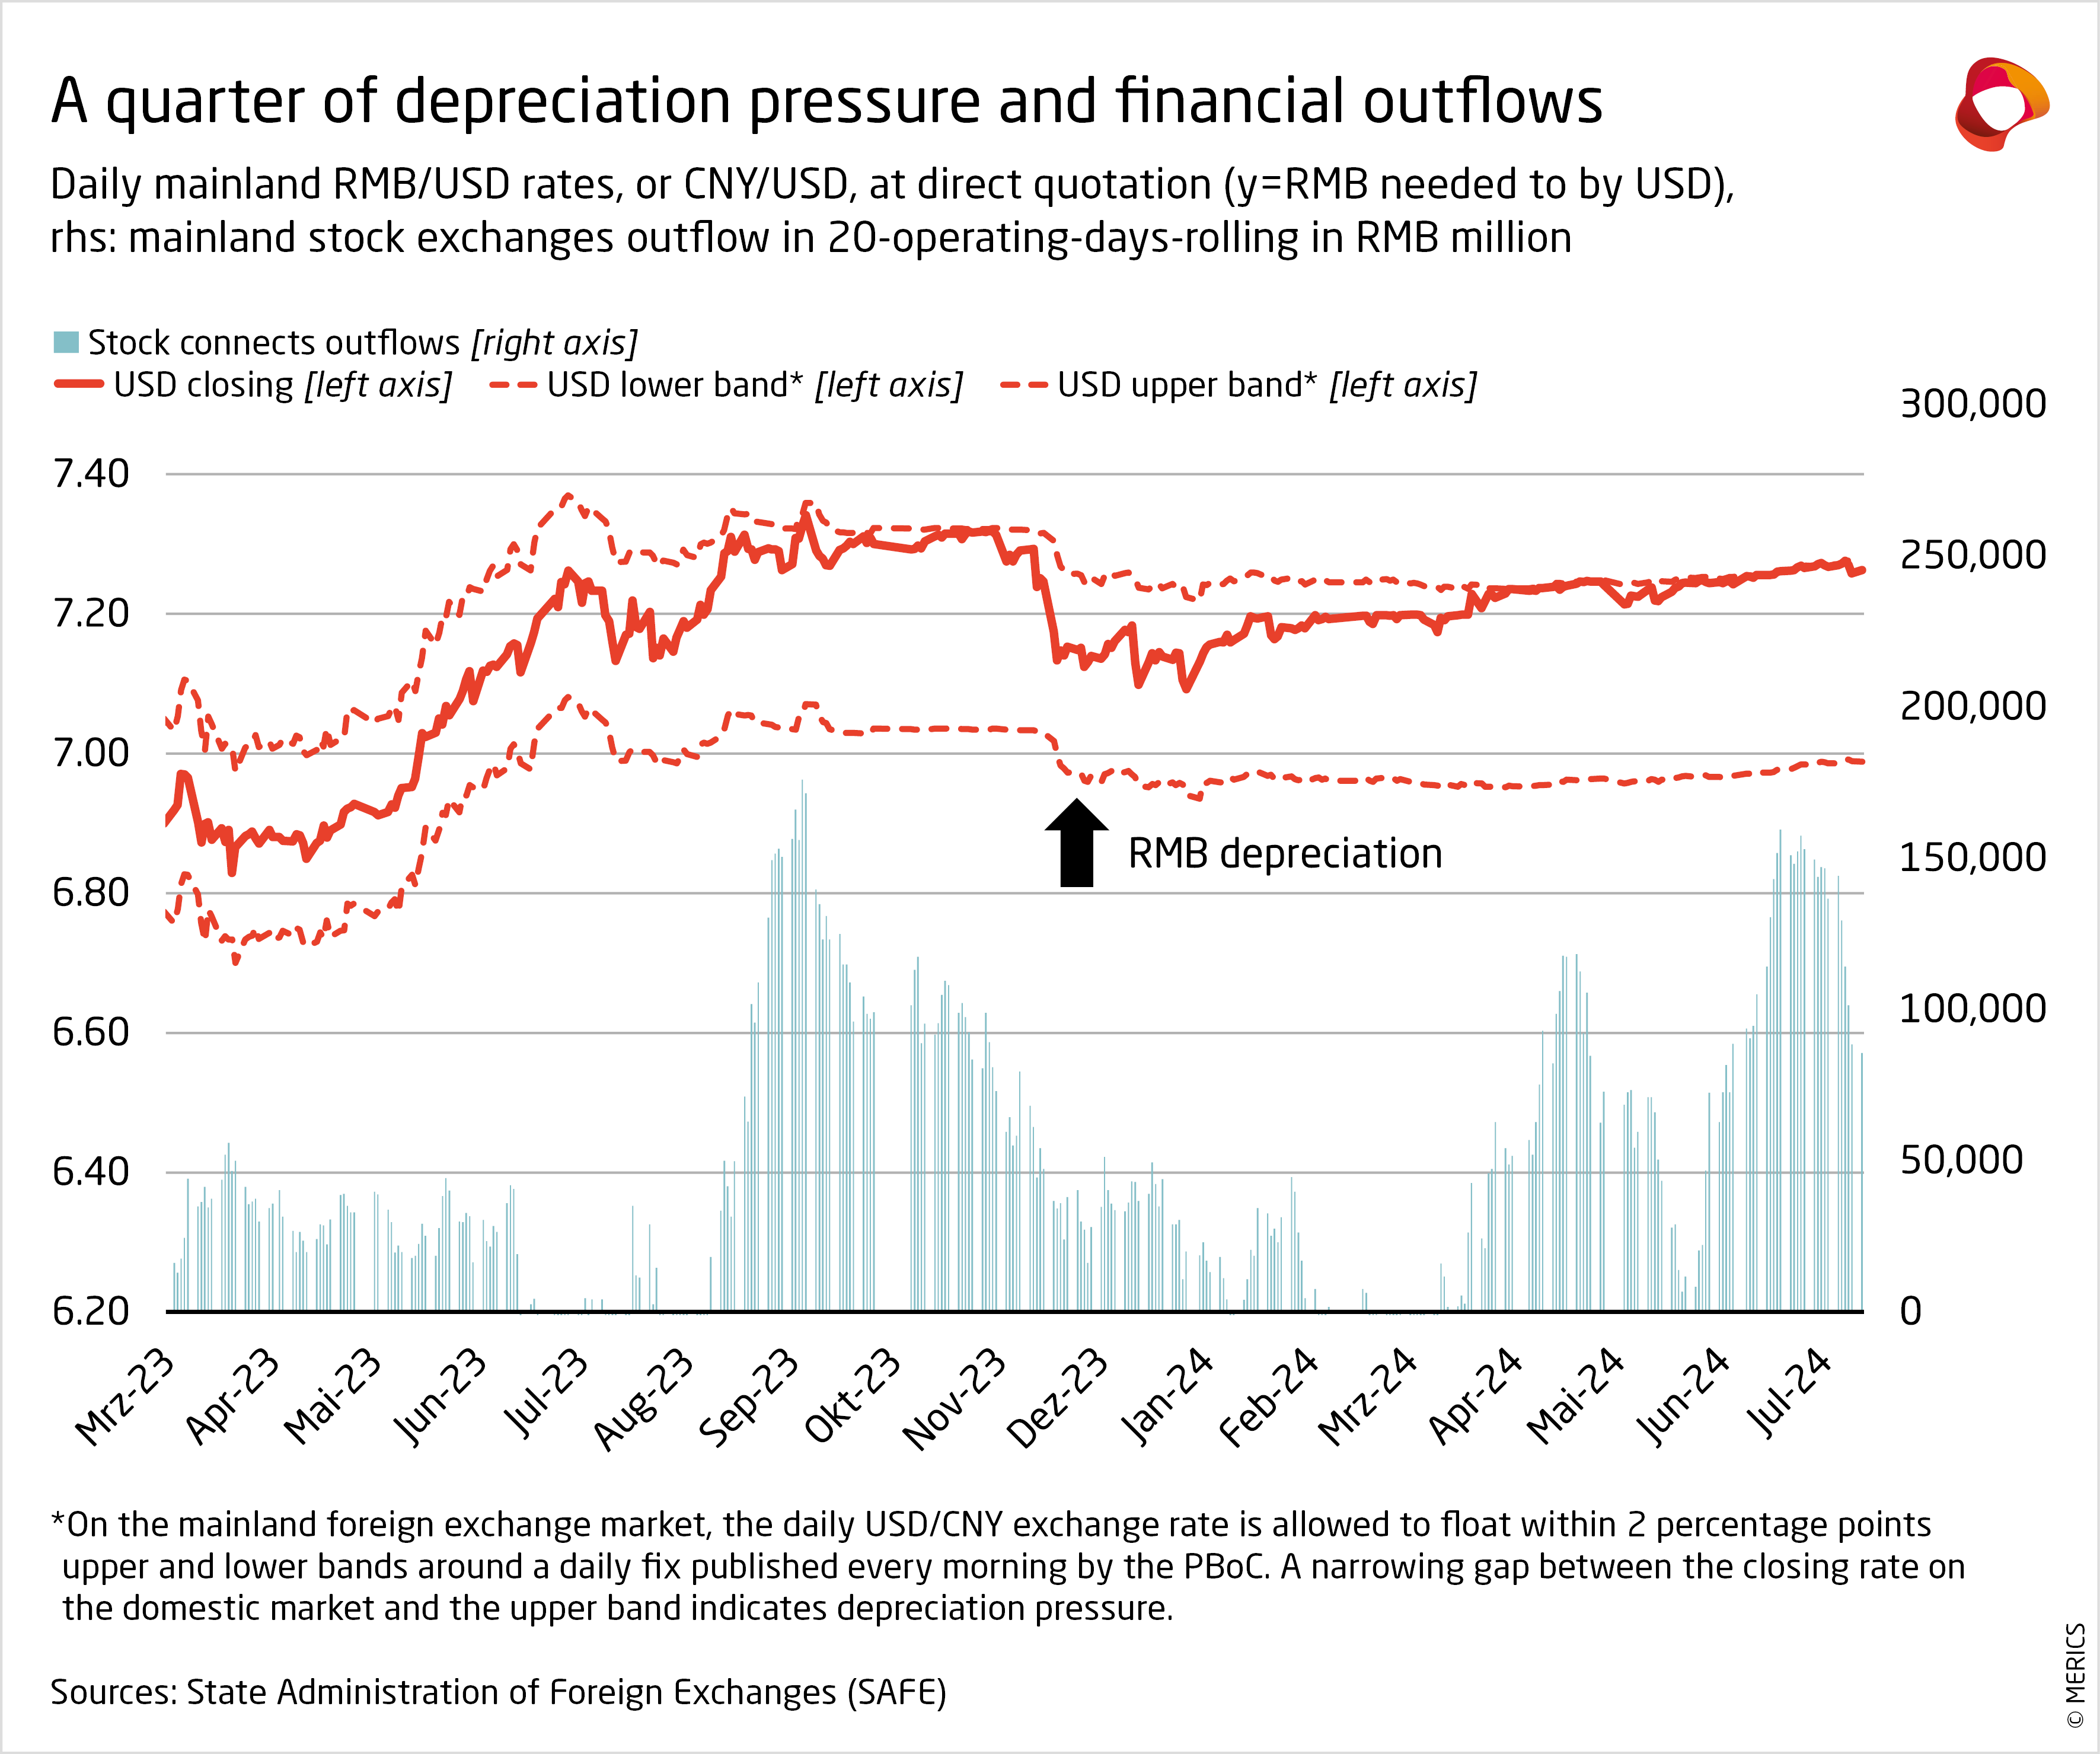
- Matters were complicated further for policy makers as pressure for financial outflow and currency depreciation despite the record trade surplus increased further over Q2 (see exhibit 2). China’s currency hit its daily depreciation ceiling almost every day during Q2, limiting the policy option to lower interest rates in support to the economy. USD/CNY exchange rate are now back at levels last seen in 2008.
What to watch: If the central bank does not deviate on its limited support for the economy, it is unlikely that monetary stimulus will impact 2024 GDP growth due to the policy lag.
Investment: Manufacturing remains the key focus of investments
Exhibit 10
![]() Hover over/tap the charts to see more details.
Hover over/tap the charts to see more details.
Exhibit 11
- Growth in fixed asset investments (FAI) started to ease in Q2, falling to the lowest level so far in 2024. After an uptick over Q1 when it expanded by 4.5 percent in March year-on-year, it fell to 3.9 percent in June. Faltering real estate investments continue to be the biggest drag on investments as government efforts to stabilize the sector have not had any noticeable effects so far (see exhibit 1).
- Manufacturing investment growth remains strong, reflecting China’s strategic national priority to strengthen the “real economy” with a focus on technology and innovation. Growth slightly slowed from 9.9 percent at the end of Q1 year-on-year to 9.5 percent in June, but in 2024 growth is considerable outpacing overall investments.
- Investments in general equipment rose by 14 percent, and by 12.6 percent for special equipment, in H1 2024 compared to the first six months of 2023. The government’s push for technological upgrading was also visible in strong rises in investment in transportations systems (rail, marine, and aerospace). Investments in in the sector grew by 28.2 percent in H1.
- The strong growth in investments in equipment reflected corporate expansion and modernization efforts. Equipment purchases have remained elevated throughout 2024, rising 17.3 percent in H1, a level that was last seen in 2013.
- Private sector investment eased to 0.1 percent in the first half of the year. This persistent weakness was mainly due to the struggling real estate sector. Private sector investments (excluding real estate development) expanded by 6.6 percent in period till June, putting it at similar levels as investments by state-owned enterprises, which grew by 6.8 percent.
- Foreign companies’ investments were impacted by insecurity about their place in the Chinese market and concerns about escalating trade frictions (see exhibit 2). Investments fell by 15.8 percent in the first half year-on-year, close to levels last seen in early 2020 when investment contracted by 16 percent.
What to watch: Foreign companies will seek signs the government means to improve the investment environment from the CCP Central Committee’s Third Plenum meeting in July.
Prices: Deflation pressures persist as demand remains feeble
Exhibit 12
![]() Hover over/tap the charts to see more details.
Hover over/tap the charts to see more details.
Exhibit 13
- Deflationary risks continued throughout the second quarter. The consumer price index (CPI) only just avoided slipping into deflation; it expanded by 0.2 percent in Q2 2024 on a year-on-year basis while prices are only up 0.1 percent in the first half of the year. Sluggish price rises suggest the economy failed to gain momentum over Q2.
- The CPI expanded by 0.3 percent in April and May, then slipped to 0.2 percent, missing market expectations of 0.4 percent in June. Falling food prices were a factor, as they have been contracting since July 2023. Price swings for different meats played a big role. For example, beef prices fell by 13.4 percent in June year-on-year.
- Volatile food prices aside, the CPI is lingering close to deflation because of persistently weak demand. Prices for consumer goods slipped back into deflation in June, while prices for services fell to the second lowest level in 2024 (see exhibit 1). Government efforts to shore up sentiment have not worked. Consumers continue to hold back on spending.
- The producer price index (PPI) inched gradually upwards over Q2, contracting by the smallest rate since December 2023. Prices fell by 0.8 percent year-on-year in June, compared to 2.8 percent at the end of Q1. The improvement was due to better prices for manufactured goods, although prices for automobiles began to tumble (see exhibit 2).
- Real estate prices failed to stabilize over Q2. The after-effects of the government-led crackdown continue to be felt. Average prices for newly-built residential apartments fell by 4.9 percent, a level last seen in 2015. Of the 70 cities tracked by the National Bureau of Statistics, 68 reported falling prices, a substantial increase from March, when the figure was 58.
What to watch: The PPI may soon turn positive again, if prices continue to improve, after 21 consecutive months in negative territory.
Labor market: Slight improvements in job market but hiring will remain slow
Exhibit 14
![]() Hover over/tap the charts to see more details.
Hover over/tap the charts to see more details.
Exhibit 15
- Official employment figures hint at a gradual improvement in 2024 but the overall picture remains grim. Surveyed urban unemployment fell to 5 percent in June, dropping from a peak of 5.3 percent in February 2024. The revised youth unemployment figures also improved over Q2, falling from 15.3 percent in March to 13.2 percent in June, the lowest figure since the National Bureau of Statistics revised the methodology in December (see exhibit 1).
- The government has stepped up efforts to support employment, particularly for fresh university graduates. For example, the Ministry of Human Resources and Social Security launched a 100-day recruitment campaign alongside industry groups and leading companies. The ministry is also continuing to reduce social security contributions for employers at companies that do not lay off workers.
- In the first five months a total of 5.7 million new urban jobs were created (latest data available). This is slightly higher to the same period last year, when 5.2 million new urban jobs were added but remains below pre-pandemic levels of 6 million in 2019. There have also been reports of major stock market listed companies downsizing and cutting labor costs to deal with lower profitability and a sluggish economy.
- Other labor market indicators also paint a gloomier picture of the labor market. Household surveys on expectations for future employment and income nose-dived over Q2 (see exhibit 2). Similarly, the purchasing managers’ index (PMI) sub-index on companies’ employment plans was below 50, indicating contraction throughout the quarter. Notably, the sub-index for service companies fell to 45.8 in June, the lowest level since November 2022.
- In July, the government announced salary caps for employees at state-backed financial institutions, amid growing concerns about rising inequality. Annual salaries will reportedly be capped at CNY 3 million, and the cap will be applied retroactively. Curbing monetary incentives in the finance sector may be part of the CCP leadership’s effort to strengthen the real economy, especially manufacturing and technology.
What to watch: If employment prospects fail to improve soon, the government is likely to roll out more support measures to stabilize employment.
Retail: Weak consumption remains a major obstacle to growth
Exhibit 16
![]() Hover over/tap the charts to see more details.
Hover over/tap the charts to see more details.
Exhibit 17
- Initial robust growth at the beginning of the year, spurred by strong holiday spending during the Chinese New Year, has waned. Throughout the second quarter, growth continued to decline, dropping to just 2 per-cent in June. Consumer spending remains sluggish, failing to give the economy a much-needed boost.
- Sales of retail commodities were particularly bad at the end of the quarter. Growth slowed to just 1.5 percent in June year on year, the weakest figure since July 2023. Households are holding back on discretionary spending, including on household appliances and jewelry (see exhibit 1).
- Weak spending by China’s urban middle class is the main reason for the slowdown. Retail growth in urban areas slowed to 1.7 percent in June, the lowest pace since December 2022. However, rural spending bucked the trend, rising during Q2. Growth slightly expanded from 3.5 percent year on year in April to 3.8 percent in June. However, this was not enough to counteract city-dwellers’ caution.
- Retail services, including restaurants and travel, continue to outperform retail commodity spending. But growth is coming down from last year’s high levels of up to 20 percent, which means overall consumption is getting less of a lift. Service spending slowed from 10 percent at the end of March to 7.5 percent in June year-on-year.
- At the end of Q1, the government unveiled cautious policies that appear to be ineffective. The impact of its year-long program to stimulate consumption, including the promotion of digital, environmentally-friendly, and health-related consumption, has been lackluster at best.
- A mood of entrenched insecurity caused by a weak labor market and the real estate crackdown’s negative impacts on household wealth is suppressing consumption. Households’ willingness to consume, captured by the National Bureau of Statistics’ consumer confidence index remains near historical lows (see exhibit 2).
What to watch: Lackluster consumption will persist unless the government rolls out more meaningful stimulus, including tax relief measures.
Autor(en)

Chief Economist

Senior Economist (Büro Brüssel)

Senior Analyst
Autor(en)
Chief Economist
Senior Economist (Büro Brüssel)
Senior Analyst